About PSS
Overview
The Plant Stress Signalling model (PSS) is a detailed mechanistic model of plant stress signalling, resulting from bottom-up manual curation. The majority of information in PSS originated from the model species Arabidopsis thaliana. PSS represents a basis for network and dynamical modelling of stress responses.
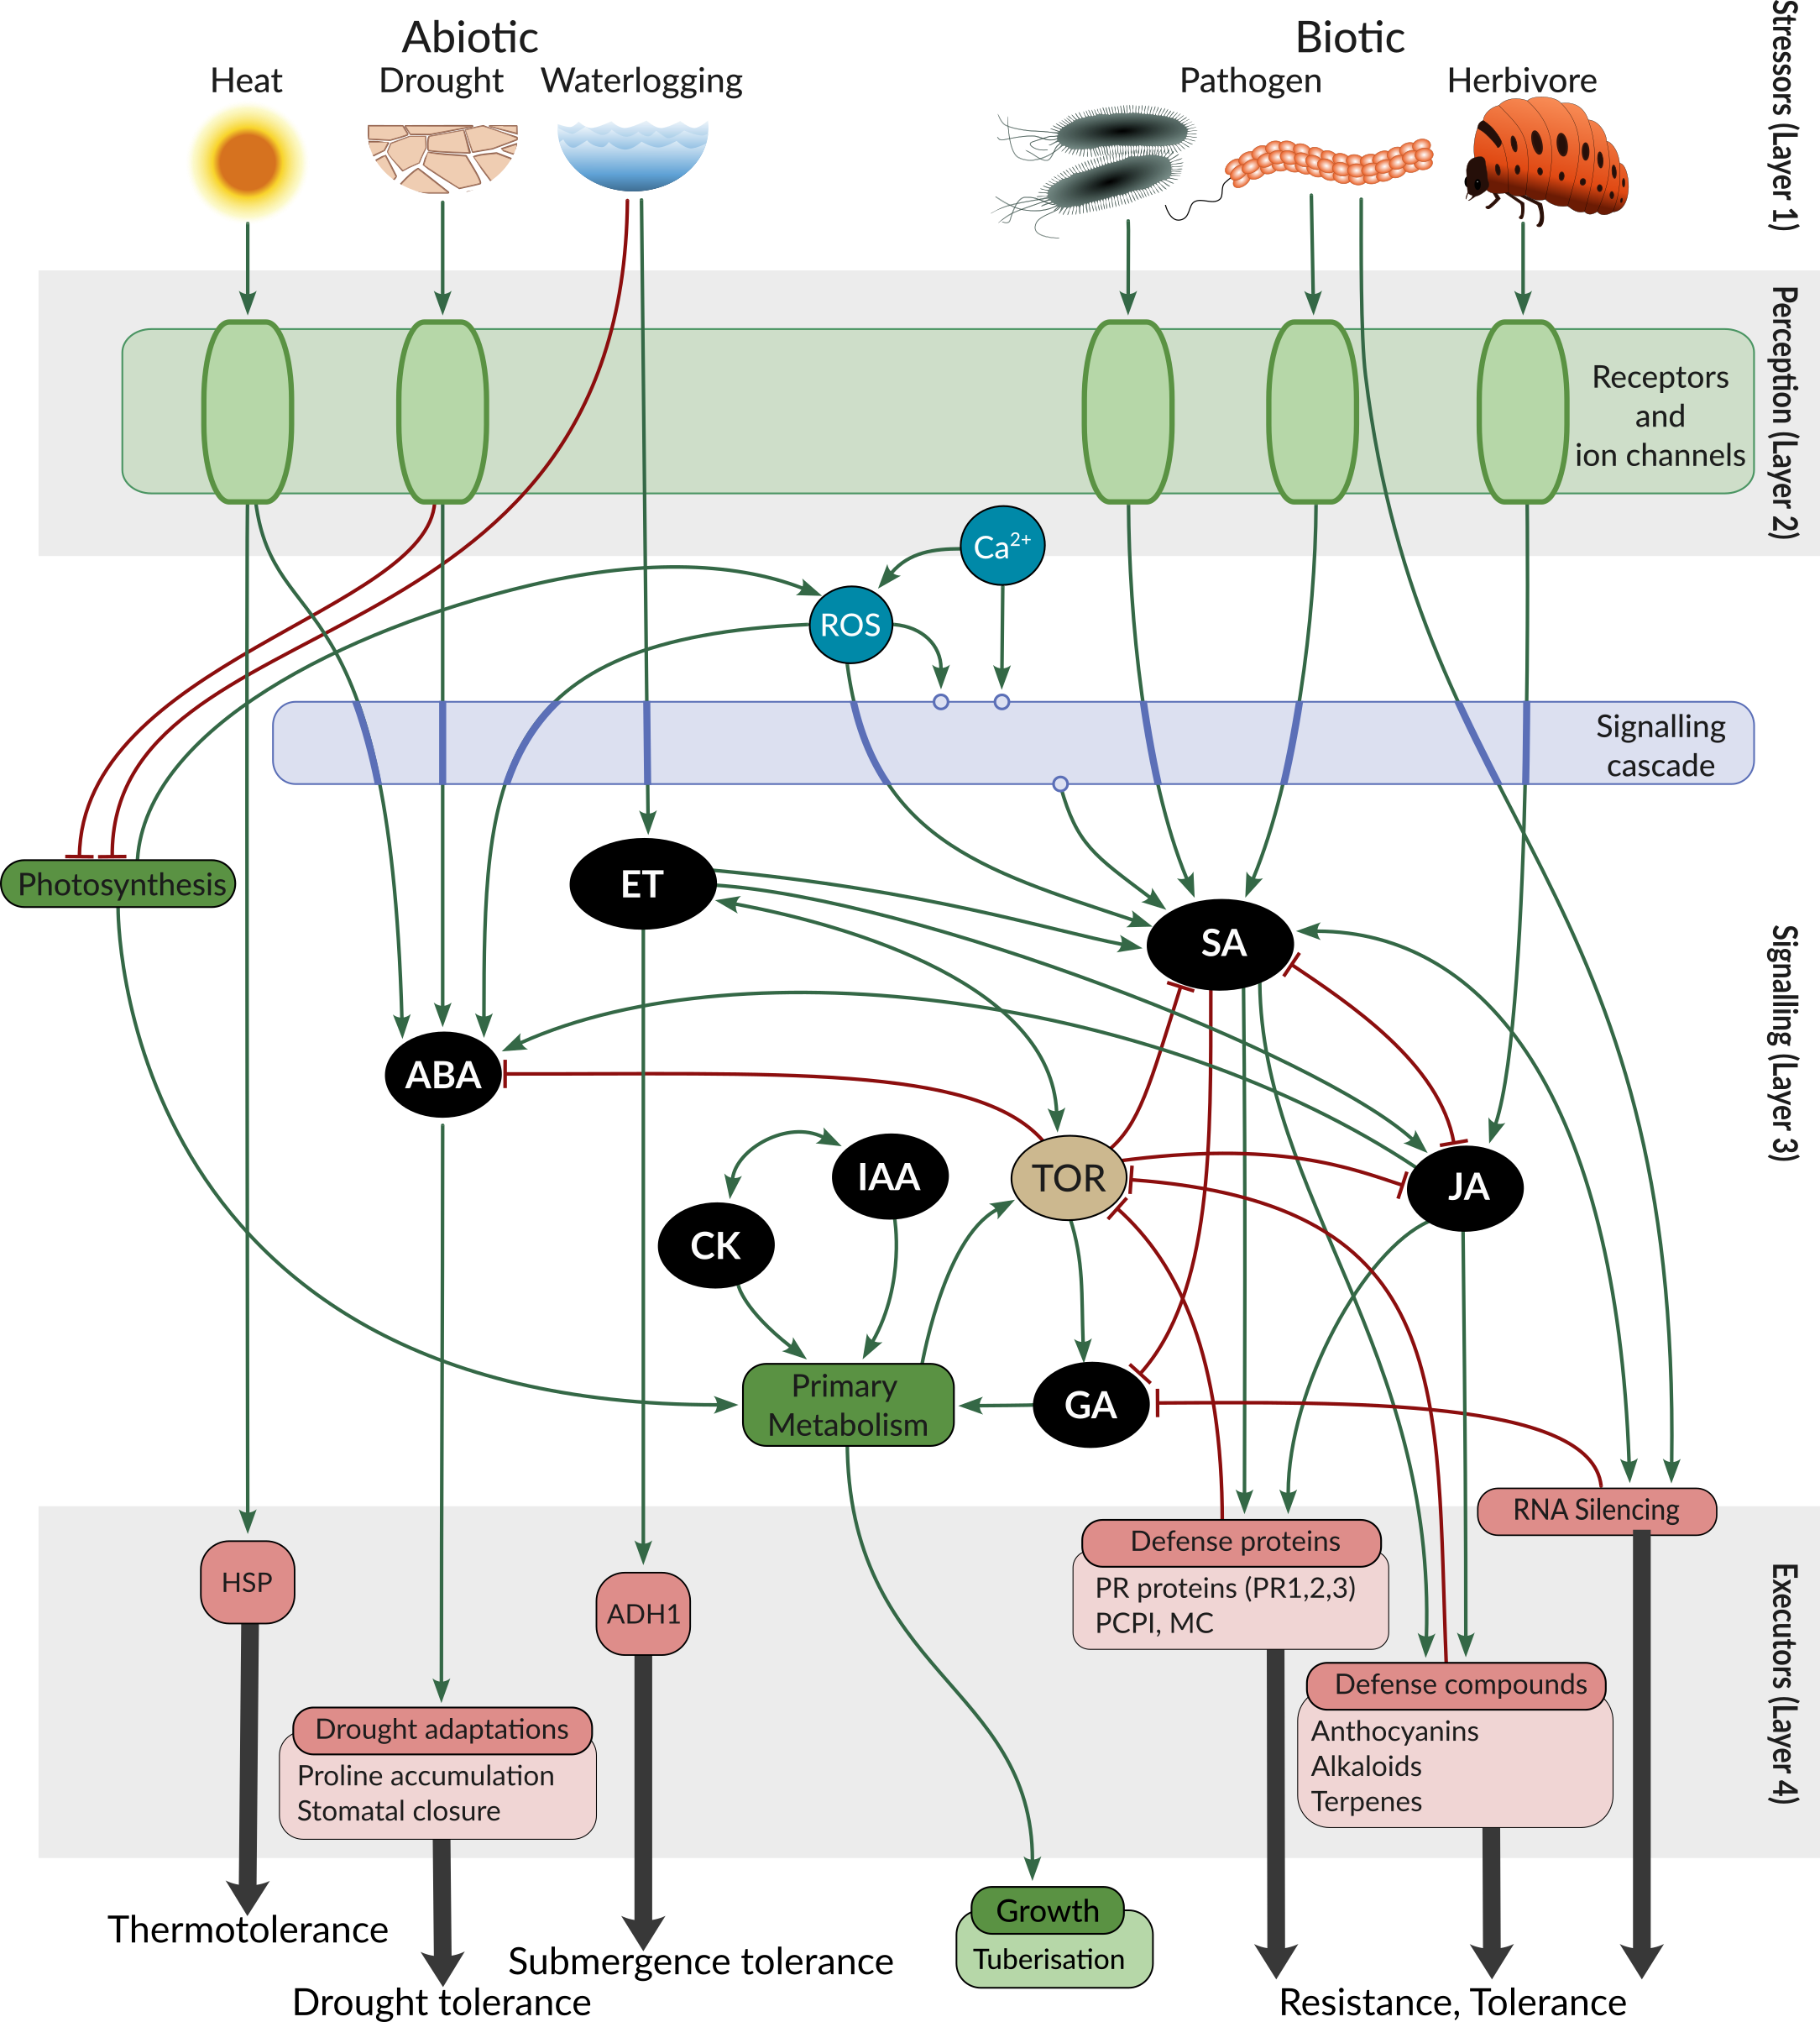
PSS covers the complete stress response cascade within the plant cell, including perception of abiotic stress factors (heat, drought, waterlogging), biotic stress factors (extra- and intracellular pathogens, herbivores), the signalling cascades (Ca2+, ROS, MAPKs), phytohormone synthesis and signalling, and relevant transcriptional and posttranscriptional regulation known to participate in stress signalling, and concludes in the synthesis of molecules providing tangible protection against stress. To capture the trade-offs between stress response and growth, PSS also includes main known regulators of growth (TOR) and major processes leading to growth. To evaluate potential impact on crop yields PSS contains tuberisation signalling from potato, as an example.
PSS is hosted as a neo4j graph database, with a dedicated schema (PSS schema) that defines the types of entities and interactions (reaction) present. To see details about the reaction types in PSS, go to Contribution guidelines | Selecting reaction type.
Functional clusters in PSS
PSS entities include genes and gene products (proteins, transcripts, small RNAs). The inherent robustness of biological systems includes (often) gene duplications resulting in multiple gene products having the same function. PSS uses functional clusters (or "FunctionalClusters" as defined in the database schema), which are groups of genes (possibly across species) that are known to mediate the same function(s), in order to accurately and succinctly represent this aspect of nature. PSS functional clusters of enzymatic genes are generally equivalent to the widely used E.C. number system (also used to associate multiple genes to a reaction in BioCyc databases such as MetaCyc), KEGG Orthology (KO) terms (used to associate multiple genes to a reaction in KEGG maps), and the “OR” clause in gene-protein-reaction (GPR) rules of metabolic models. PSS also contains a significant number of regulatory interactions in addition to enzymatic reactions, and thus functional clusters extending beyond enzymes to also include transcription factors and non-coding genes (such as microRNA families).
PSS functional clusters are defined using sequence similarity between genes (orthologues and paralogues) and experimental data that confirmed functional overlap.
All information to enable users to use PSS on the basis of individual genes instead of functional clusters is also available: users can access the same information in PSS on the gene level, by utilising the gene level representation of PSS interactions in CKN, for example the CKN Explorer rank filter (rank 0 is equivalent to PSS) or the skm-tools rank filter function in Python, or alternatively, the DiNAR compatible download of PSS (where functional clusters are expanded to the individual arabidopsis identifiers).
When a functional cluster of interest contains more than one gene, it is hard to determine which single gene should be prioritised for further study. Prioritising genes within a cluster of interest can potentially be done based on additional experimental data, for example by selecting the functional cluster member with either the most significant or the most consistent gene expression changes. However, researchers have to be aware, if they are attempting to create a knock-out mutant, not taking into account functional orthology may result in less of an effect on the phenotype than expected, and they may need to knock out each of the members in order to obtain adequate suppression of the signal under consideration.
PSS explore options
-
Newt interface
Available at: Newt interface
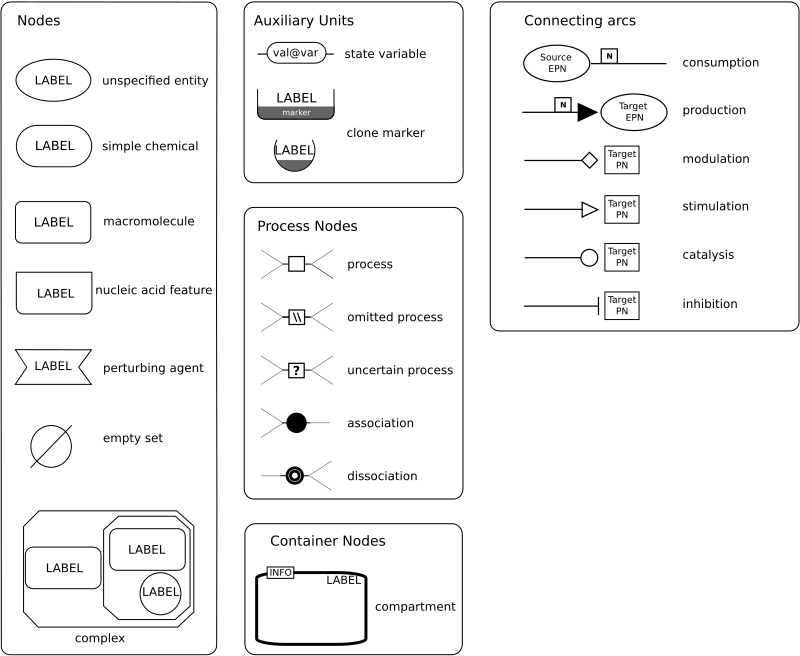
In order to display PSS from a systems biology perspective, SKM utilizes Newt, an open source, browser based Systems Biological Graphical Notation (SBGN) editor and viewer. For more information on Newt, and for tutorial and user instructions, please see: Newt Pathway Viewer & Editor.
Within the Newt representation, the reactions grouped by biologically relevant pathways. Nodes are coloured by molecular type, and to be able to also discern the cellular compartment, node borders are coloured by compartment.
The colour legend is as below:The glyph legend (simplified from SBGN reference guide):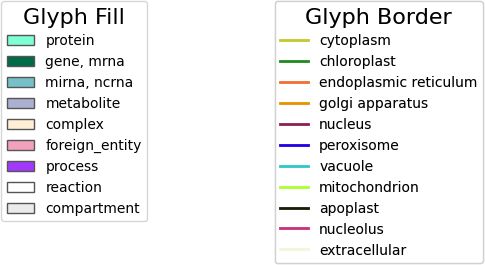
Search result nodes are highlighted by a thick red border:

Note: on entry of a new reaction, the page needs to be fully refreshed for the new reaction to appear.
-
PSS Explorer
Available at: PSS Explorer
The biomine-like exploration interface allows for interactive search queries of PSS, shortest path, and neighbourhood extraction.
Right clicking on a node brings up a sub-menu, including expanding node neighbours. Right clicking on the canvas brings up the option to freeze all node positions. More information on the interface is available in the side panel.
When applicable, the sub-menu of the node also contains a link to query the Arabidopsis identifiers associated with the node in KnetMiner.
Using the "Export" menu, the results of a search can be saved as a edge table, node table, or PNG.
Note: on entry of a new reaction, the page needs to be fully refreshed for the new reaction to appear.
-
Searching by property
Available at: Search
In the "Search" interface, users can find reactions and FunctionalClusters in PSS via a number of properties (such as DOI, PMID , or node identifiers).